Walk into many Environmental Services departments in this country and ask the director what their average room clean time is. Ask them what their supply cost per patient day looks like this month versus last month. Ask them how many ED terminal cleans were completed last Tuesday.
Many cannot tell you. Not because they do not care. Because nobody taught them to track it, nobody built the expectation that they should, and the department has been running on gut instinct and tribal knowledge for so long that it feels normal.
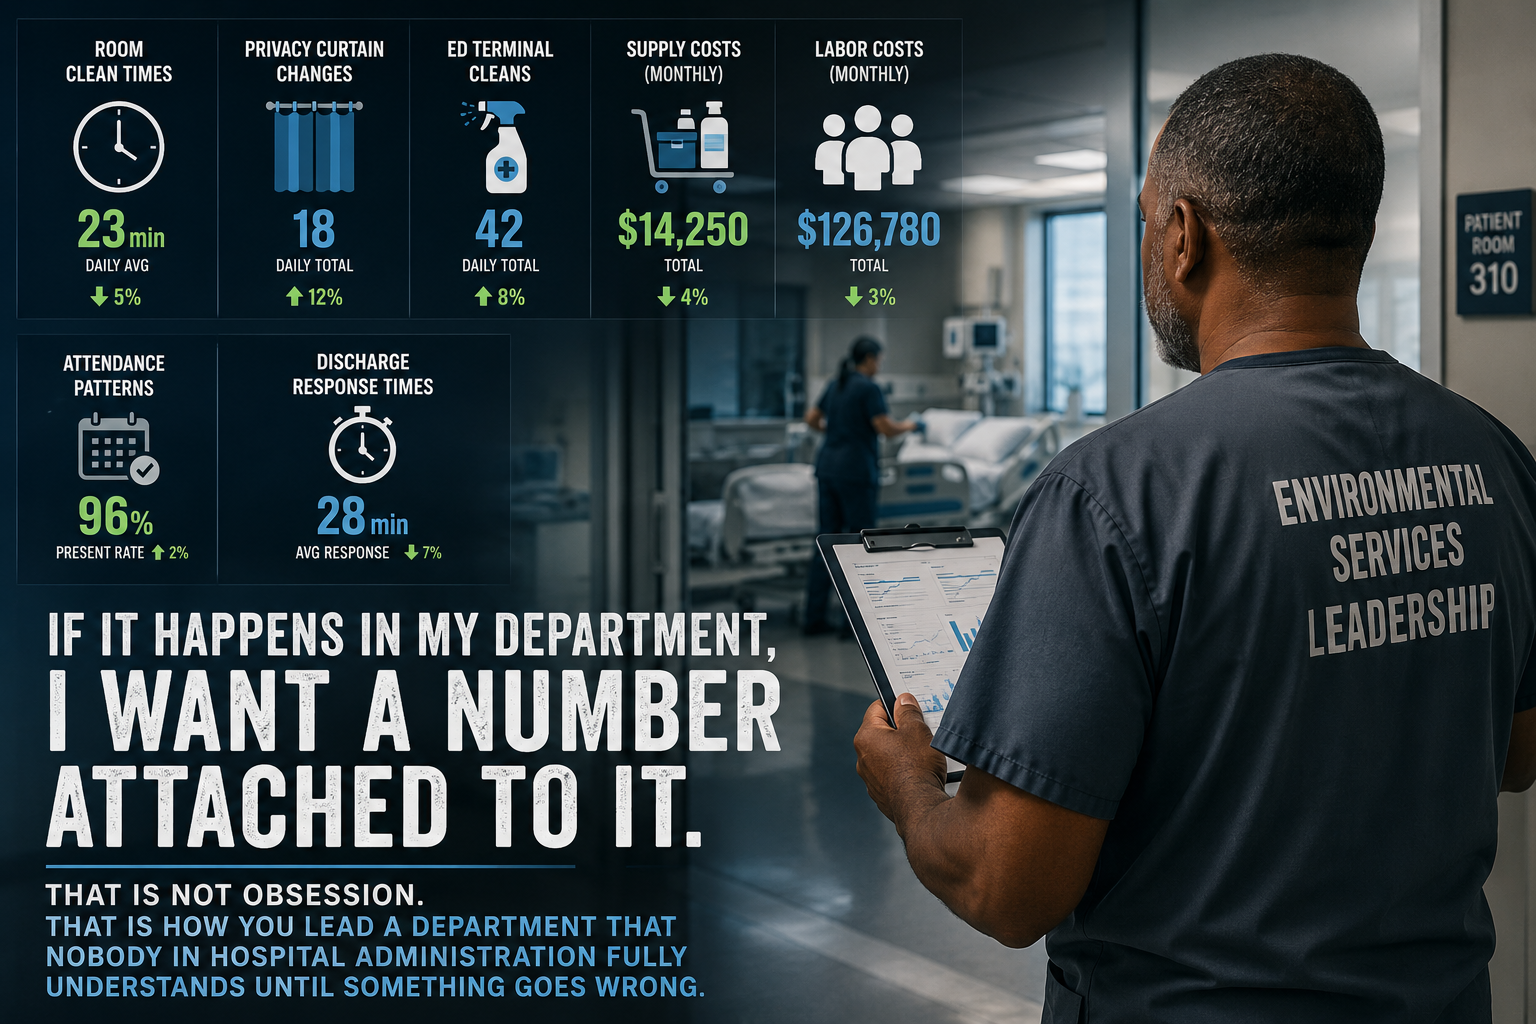
I am not built that way. I track everything.
Room clean times. Privacy curtain changes. ED terminal cleans. Supply costs. Labor costs. Attendance patterns. Discharge response times. If it happens in my department, I want a number attached to it. That is not obsession. That is how you lead a department that nobody in hospital administration fully understands until something goes wrong.
The problem with running on instinct
EVS is one of the most complex departments in a hospital. We touch every floor, every unit, every patient room. We respond to discharges, traumas, spills, outbreaks, and scheduled deep cleans, often simultaneously, with a workforce spread across multiple shifts and two or three physical buildings. The variables are enormous.
When you manage that complexity without data, you are making decisions based on the loudest complaint, the most recent incident, or whoever caught your attention that morning. You think you know where your problems are. You are often wrong.
The unit you are worried about is not always the unit that needs your attention. The employee you trust is not always performing the way you think. The shift that looks fine on paper is running 20 percent over on supply costs every single week. You do not know any of this without the numbers.
What the numbers actually reveal
When I started tracking privacy curtain changes systematically, I found a method that actually works. Every curtain change is logged by room, by date, and by the staff member who changed it. For isolation rooms, those records cross-check against UV treatment logs. That combination gives you a complete picture of what was done, when, and by whom.
The benefits went beyond what I expected. Surveyors were impressed. Having that documentation ready and organized during a survey is a completely different experience than trying to reconstruct what happened from memory. And an unexpected bonus came from the tracking itself: staff started reporting curtains that needed repair rather than just hanging them back up. Our laundry company began handling those repairs as part of the process. A data system that started as an infection control tool became a quality control system for the curtains themselves.
When I track ED terminal cleans by day, I can see trends develop over weeks and months. A pattern that shows up on certain days of the week is not random. It connects to volume, staffing, and what else is happening in the department at that time. Tracking by shift is the logical next step, but day-level data alone already tells a story worth paying attention to.
Labor cost tracking by pay period tells me when overtime is creeping before it becomes a budget problem. Supply cost per patient day tells me when something changed in how we are using product, which often means someone changed a process without telling anyone.
Attendance data, tracked carefully over time, shows patterns that protect both the employee and the department. Someone missing every other Monday is a different conversation than someone who has missed three Tuesdays in a row following a pattern that started six weeks ago.
What this does for you as a leader
When you walk into a meeting with your CNO, your CFO, or your infection control team and you have actual numbers, the conversation changes. You are not defending your department. You are presenting it. There is a difference.
When something goes wrong and someone asks what happened, you have a timeline. You have data points. You can show exactly when the problem started, what changed around that time, and what you did about it.
When you are advocating for more staff, better equipment, or a process change, you are not asking based on how things feel. You are showing what the data says and making the case from evidence.
This is how EVS earns its seat at the table in a hospital system. Not by cleaning rooms quietly and hoping administration notices. By speaking the language administration respects, which is the language of numbers.
Where to start
You do not have to track everything on day one. Pick two or three metrics that connect directly to your biggest current challenge. If discharge response time is your pain point, start there. If supply costs are out of control, start there. Build the habit of collecting the number, reviewing it weekly, and acting on what it tells you.
The goal is not to drown in spreadsheets. The goal is to know your department well enough that nothing surprises you, and that when it does, you can find out why.
Data does not run your department. You do. But the leaders who know their numbers are always one step ahead of the ones who do not.