
Most people think continuous improvement means working harder and staying alert. Fix problems as they come up, respond fast, stay on your toes. In EVS, we are trained to respond. But responding needs to lead to improving.
Real continuous improvement is a discipline. It runs on tools, structured frameworks and real data that tell you exactly where to look, what to fix, and how to know whether what you did actually worked. When I replace gut feel with a repeatable method, things change. Problems get solved faster, and waste gets eliminated at the source instead of patched over. We stop having the same conversations about the same problems.
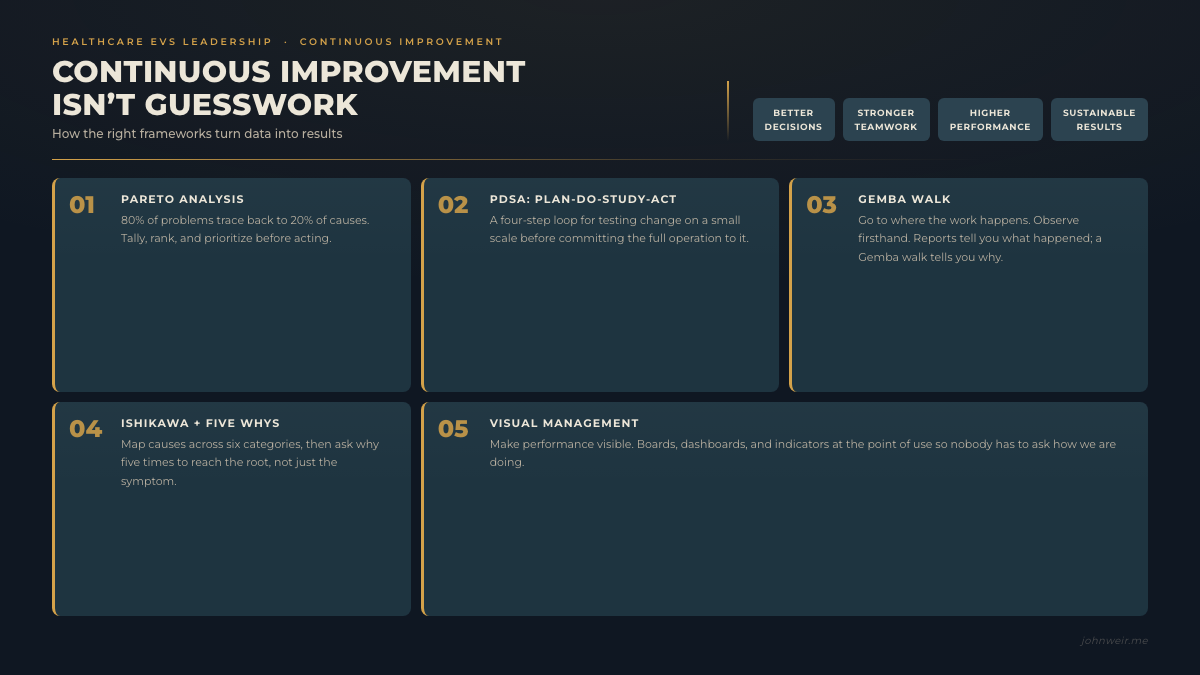
These five tools drive most of the results: Pareto analysis, PDSA, Gemba walks, the Ishikawa fishbone diagram paired with Five Whys, and visual management. I have used PDSA and Five Whys most often. The others I have studied and sometimes applied in how I approach operational problems. Here is how they work and why together they change the way a team makes decisions.
PARETO ANALYSIS:
Pareto analysis applies the 80/20 rule to problem solving: roughly 80 percent of your defects, delays, or costs typically trace back to about 20 percent of the underlying causes. In EVS, that might mean 80 percent of your patient satisfaction complaints trace back to two or three cleaning gaps. Or that most of your supply waste comes from one unit or one shift pattern. Most of your attendance problems come from 20 percent of your staff.
The process is straightforward. Tally the frequency or cost of issues, rank them, and plot them on a Pareto chart. What you get is a clear priority list instead of a pile of problems that all feel equally urgent.
This matters because EVS teams have limited time, limited staff, and limited budget. Without data, it is easy to spend a week solving a problem that barely moves anything while the two or three causes driving most of the pain go untouched. Pareto analysis forces one question before any corrective action gets taken: which few things, if fixed, deliver the most impact? That question replaces “everything feels urgent” with “this is what actually matters,” and that shift alone changes how a team decides where to put its energy.
PDSA:
The tool I use more than any other is PDSA. Plan-Do-Study-Act, sometimes called the Deming cycle, is a four-step loop for testing change before committing the entire operation to it:
Plan: Define the problem, set a goal, and design a small-scale change based on what the data is telling you.
Do: Test that change on a limited scale. Not a full rollout.
Study: Measure what actually happened and compare it honestly to the plan.
Act: Standardize the change if it worked. If it did not, cycle back through Plan with what you now know.
PDSA is what keeps continuous improvement continuous. Teams that skip straight to Do end up rolling out fixes at scale that were never validated, and they rarely find out why something failed until it fails again, and by then the cost is higher. Because PDSA is a loop and not a one-time event, it builds the habit of testing assumptions with small, low-risk experiments and only scaling what the data proves works. I have seen more real improvement come from disciplined small tests than from large initiatives that were never properly evaluated before they were deployed.
THE GEMBA WALK:
Gemba is a Japanese term for “the real place.” A Gemba walk means going to where the work actually happens, the floor, the unit, the patient room, to observe the process firsthand instead of relying on secondhand reports.
In EVS, this looks like walking with a tech through a full room turnover and watching what actually happens instead of reviewing audit scores from a laptop. Reports and dashboards tell you what happened. A Gemba walk tells you why. It surfaces workarounds staff have quietly built into their routine because the documented method does not actually work the way it is written. It reveals bottlenecks that never appear in a spreadsheet and small frustrations that erode engagement long before they register as a metric miss.
A well-run Gemba walk is not an inspection. It is not a search for who is doing something wrong. It is a chance to ask questions, listen to the people doing the work, and treat them as the experts on their own process. That shift, from directing to observing and asking, is what builds the kind of teamwork that supports improvement. People engage differently when they know leadership is there to understand, not to judge.
THE ISHIKAWA FISHBONE DIAGRAM:
Once Pareto analysis has identified which problem deserves attention, the Ishikawa diagram helps map every possible reason it is happening. The problem sits at the head of the fish, and the team brainstorms potential causes across major categories: people, process, equipment, materials, environment, and measurement. Each category branches off the spine like bones.
What makes this tool worth the effort is that it stops the team from settling on the first plausible explanation. In a healthcare environment, surface-level fixes tend to mask deeper systemic issues that come back later. The fishbone forces a systematic look across every category before anyone proposes a solution.
Five Whys is the tool I pair with it directly. Once the fishbone has mapped the possible causes, Five Whys is the drill. Pick the most likely branch and ask why, then ask why again, following each answer to the next level of cause until you reach something specific and actionable. In practice it usually takes three to five rounds before you get from “the room was not cleaned to standard” to “the cart restocking schedule does not align with shift start times and techs are starting rooms without full supplies.” That is a fixable problem. The surface version was not.
Together, fishbone and Five Whys give a team the full picture: the map of what could be causing the problem, and the method for drilling down to what actually is.
VISUAL MANAGEMENT:
Visual management turns data, status, and standards into something everyone can see without having to ask: performance boards, color-coded indicators, job aides, standard work instructions posted at the point of use, shared dashboards. The goal is simple. Nobody should have to ask how we are doing. The answer should be visible the moment they walk into the space. This is why I have a department visual board.
This is the connective tissue that makes the other tools sustainable. A Pareto chart or PDSA experiment that lives only in a spreadsheet on one manager’s computer fades. The same information on a visible board, updated daily and discussed in a short team huddles, becomes part of how the team thinks and talks about their work. It also closes the information gap between leadership and the front line. When everyone is looking at the same data, you eliminate a lot of the friction that comes from people operating on different assumptions about how things are going.
WHY THESE TOOLS WORK TOGETHER
None of them are impressive on their own. The real value is what they produce together, consistently, over time.
Better decisions. Pareto analysis and the fishbone diagram replace opinion with evidence about what to fix and why. PDSA replaces confidence with proof before any change is scaled. Decisions made this way are more likely to be right.
Stronger teamwork. Gemba walks put leaders alongside the people doing the work, not above them. Visual management gives every team member the same shared picture of performance. Both build trust and shared ownership instead of top-down directives that people quietly work around.
Higher performance. When we direct our effort at the 20 percent of causes driving 80 percent of the problem, and fixes are tested before they are scaled, teams reduce wasting cycles on low-impact activity. Performance improves because effort is pointed at what matters.
Sustainable results. A one-time fix fades. A PDSA loop backed by visual tracking does not, because the team keeps checking, adjusting, and holding what was gained instead of assuming it will hold itself.
THE BOTTOM LINE
Continuous improvement fails when it is treated as a personality trait, something certain people are naturally good at and others are not. It succeeds when it is treated as a discipline, with tools that tell you where to look, how to test your assumptions, and how to keep everyone honest about the results.
Pareto analysis tells you what to prioritize. PDSA tells you how to test it safely. Gemba walks ground you in what is actually happening. The fishbone diagram and Five Whys get you to the actual cause. Visual management keeps everyone aligned and accountable every day.
Guesswork gets lucky sometimes. Frameworks and data get it right and keep getting it right. That is the entire point of continuous improvement.
#EVS #HEALTHCARE #LEADERSHIP #CONTINUOUS-IMPROVEMENT
